Texture Analysis SolutionsFlatbread Burst Strength
Highlights
- Objective process developed to measure the tear resistance and ultimate strength of various flatbread recipes for manufacturing checks
- Repeatable, quick and representative strength and extensibility test method using a software-controlled texture analyzer
- Industry-specific fixture to grasp and stretch the products under tension and simulate the penetration by a finger, perceived as elasticity
- Quantified hardness and stickiness texture correlated to the ideal acceptable softness ranges and resilience for white grain through to wholemeal formulations
Situation
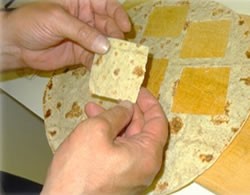 The following data was gathered for a producer of bakery flatbreads in an effort to develop a new methodology that would allow for consistent and repeatable assessment of their products in an objective manner. Eight total samples were submitted in order to get baseline results for a range of products. It was important to the customer that the system be applied to the full range products. Seven of the products were similar in consistency and thickness, while one of the samples was quite different.
Method
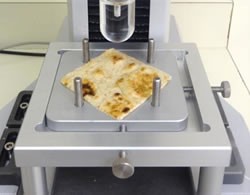 All testing was completed using Food Technology Corporation’s (FTC) TMS-Pro Texture Analyzer, fitted with a 250N Intelligent Load Cell (ILC). The fixture that was used was the TMS Extensibility Fixture along with a 25.4mm (1 inch) hemispherical test probe.
For each test replication, a single piece of flatbread was cut into a 2.5 inch square piece using a template. The sample was then placed on the extensibility to fixture and secured into place using the top plate.
The TMS-Pro was programmed to puncture through each sample of flatbread at a speed of 400 mm/min.
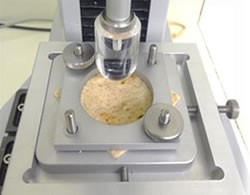
Each time the probe traveled a distance of 40 mm, which was determined to be the needed distance to puncture completely though the sample. After the test cycle was completed, the TL Pro software package was used to make several different calculations on the samples. These include peak force, compressive work, and compressive slope. By looking at all of these results combined, the overall extensibility of the product could be determined.
Results and Discussion
Below is the graphical representation of the samples that were tested. The X-axis is displacement and the Y-axis is force.
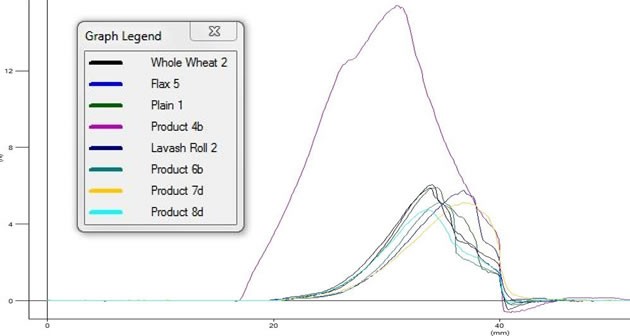
Each trace is a sample that is representative of the whole group. Product 4 was very different in thickness and consistency. This is why it shows up the way it does on the graph. When compared to the rest of the samples within the sample group, it is very similar.
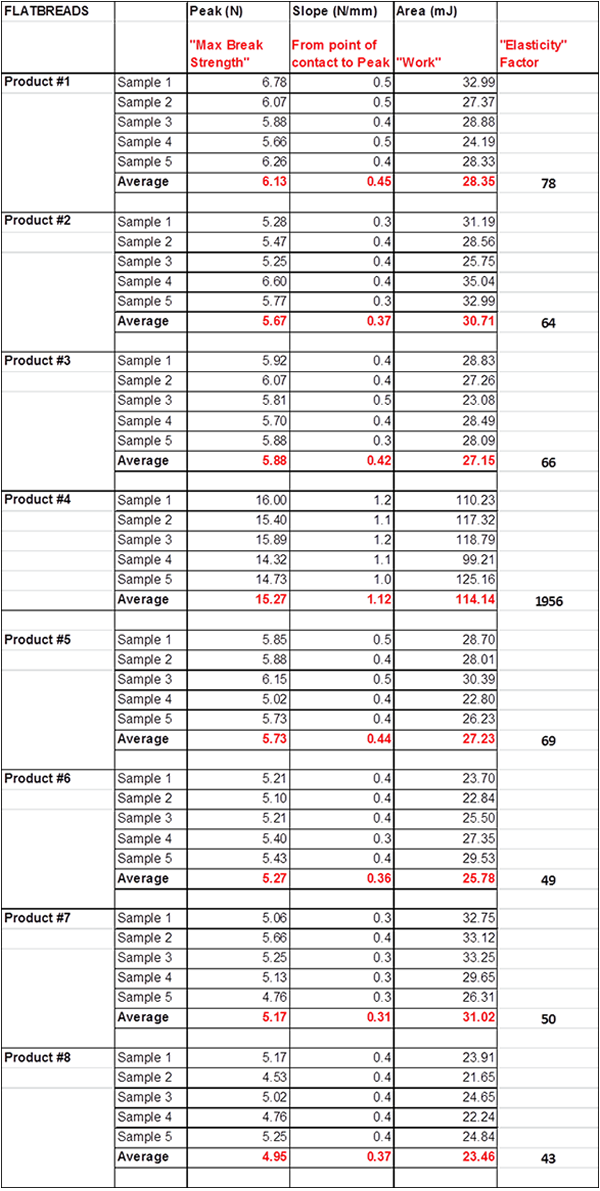
Calculations performed from the test were Peak (Newton), Slope (Newton/Millimeters) and Area (MilliJoules). Peak is the maximum force or break strength, slope is an indicator of the firmness of the product and area indicates the amount of work being done to compress the product/how much resistance did the product give. The chart below shows the values obtained from the calculations & correlates to the graphs above.
“Elasticity” Factor:
This value was reached by multiplying the average peak, average slope and average area together. This value is a reference point as to the elasticity, as one can see Product #4 has the highest elasticity whereas Product #8 has the lowest.
The most important characteristic to the customer was the elasticity or how much the product can stretch. As this is not a product of one measurement, an additional calculation had to be done in order to take into account all of the contributing factors (peak force, work, slope).By combining all of this data into a “single point” calculation that is actually the summation of multiple points, a singular number can be assigned to represent the elasticity of the product.
Significance
Based on these results, it can be concluded that methodology developed by FTC would be a viable way to evaluate the elasticity of the products. The final data shows that while a difference in the individual products is minute, excluding product 4, the testing produces consistent and repeatable data in way that is simple to perform. Additionally, as this data is objective, it takes any variation out of the equation that could be caused by introducing the human element to the equation. Going forward, the processor will be able to establish target ranges for the individual products, ultimately creating a situation where quick decisions on processing parameters can be made based on real and true information.
